Previously through thorough research, it was found that COVID-19 has had a significant impact on consumer sentiment in many nations. Consumers in China, India, and Indonesia continually express higher levels of optimism than the rest of the globe, whereas consumers in Europe and Japan continue to be pessimistic about their nations’ economic prospects following COVID-19. With the exception of Italy, optimism has waned across Europe, in accordance with an increase in confirmed cases since late July.
It was also noticed that Divergent attitudes are mirrored in purchasing intentions across categories. Consumers in most nations plan to continue shifting their spending to necessities while reducing spending in most discretionary areas. However, spending in China and India is rebounding beyond groceries and household items. Consumers in China intend to spend more on discretionary items like travel and clothing, indicating that the country is recovering faster than other countries. As they prepare for future festivities and the wedding season, which runs from October to December, Indian consumers indicate a stronger desire to spend across all categories.
Referring to Consumer Behaviour Surveys in the United States, the United Kingdom, Asia, and Australia were found out how online purchasing and social media habits have changed post-pandemic, as well as what they value and seek most from today’s firms. Their responses provide Key Consumer Behavior Statistics that can assist firms in navigating the post-pandemic market and better meeting the needs of today’s consumers. Have a look!
The following are some of the significant themes we discovered –
Table of Contents
Key Findings for Consumer Behavior Statistics
- When it comes to picking which brands to like and support, 88 percent of customers feel authenticity is vital (with 50 percent saying it is extremely important).
- Customers feel businesses should deliver more authentic purchasing experiences to customers like them, according to 83 percent of shoppers.
- Brands must provide individualized experiences, according to 70\% of respondents.
- 67 percent of people say their online purchases have increased since the outbreak, with 91 percent expecting to continue doing so in the future.
- 72 percent of consumers say the amount of time they spend on social media has increased since the outbreak. When it comes to online buying, 56\% of customers say they are more affected by images and videos from social media now than they were before the pandemic. UGC has a strong influence on 79 percent of people’s purchasing decisions, while only 9 percent feel it has a minor impact. Their purchases are influenced by the content of influencers.
- When it comes to making purchasing decisions, 72 percent of shoppers say they want to see real customer images and videos on eCommerce sites.
- 80 percent of buyers think they’d be more likely to buy anything from an online company if it contained photographs and videos from real customers on its website. Because the site didn’t have any user evaluations or photographs,
- 58 percent of customers left an eCommerce business without making a purchase (64 percent of Gen Z)
On looking at the findings with more detail, the following aspects were found:
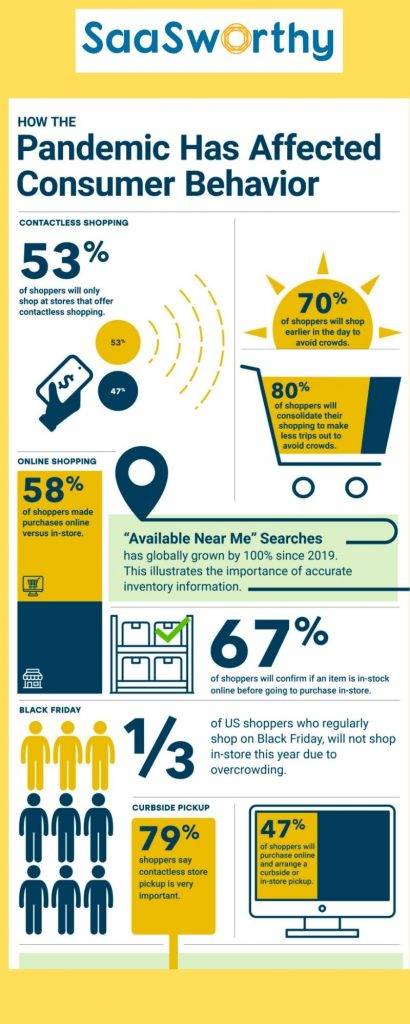
Online Shopping Is The New Normal
According to a consumer sentiment poll conducted by McKinsey in 2020, more individuals expect to make portions of their purchases online after COVID.
This is supported by our findings, which show that 67 percent of consumers have boosted their online purchases since the outbreak began. In fact, 27\% of respondents think their internet buying has increased significantly.
People not only report making more online purchases, but they also aim to keep up their newfound eCommerce buying habits, with 91 percent indicating they’re likely to do so in the future—and 52 percent saying they’re very likely to do so.
According to a previous NetElixir study, 73 percent of consumers are comfortable buying from a new brand online on an average to a high level. 59 percent of people we polled said they’ve bought from new brands since the epidemic began, and 75\% say they’re likely to keep buying from those new brands in the future.
We Are In The Age of Content And Social Media Is The New Cool
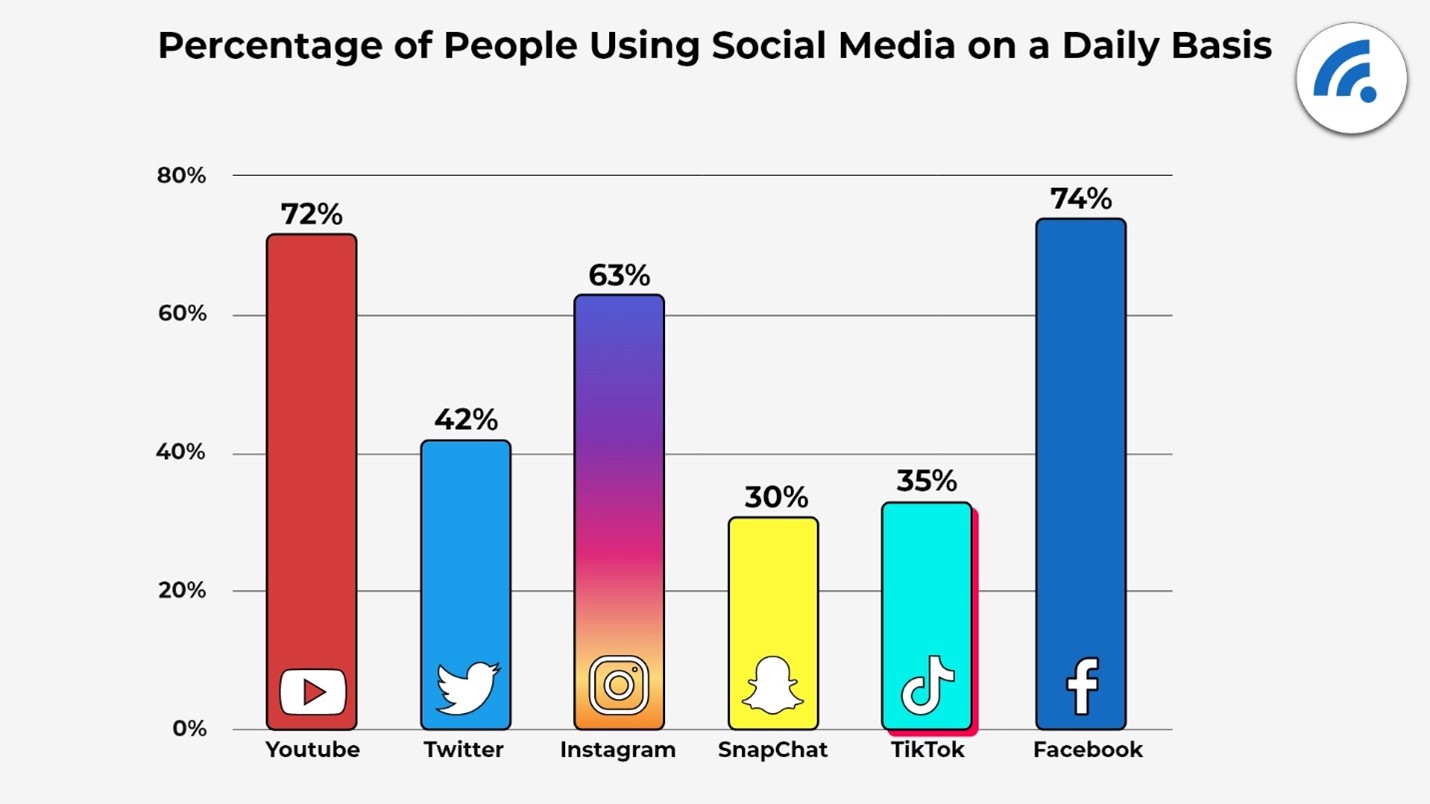
We saw data after stat last year about how consumer behavior reflected increased social media usage. According to eMarketers, during the epidemic, up to 51\% of adults used social media at higher rates. Additionally:
- In the early days of the pandemic, Instagram observed a 70\% spike in live viewing.
- YouTube usage increased by 15.3\%.
- TikTok usage has climbed by 15.4\% on a daily basis.
COVID-19 influenced people’s social media habits, according to our findings. 72 percent of people in all areas and age groups said their time spent on social media has grown since the global pandemic began. This percentage is much higher among Gen Z, with 79 percent stating their social media usage has increased, and 46 percent saying it has increased significantly.
The amount of time people spend on social media has increased, as has the amount of content they publish. A large percentage of respondents (41\%) claim their social media posting frequency has increased since the outbreak began, with Millennials’ posting habits increasing slightly higher (43\%) than the national average.
Consumers Today, Seek A More Individual Personalized Experience From Brands

This is one of the most crucial takeaways from our consumer behavior statistics report. When it comes to picking which businesses to like and support, the vast majority of customers (88\%) feel authenticity is vital, with 50\% saying it is extremely important.
However, today’s brands do not appear to be delivered in the eyes of customers. According to our research, 83 percent of consumers say retailers should deliver more real shopping experiences to customers like them, indicating that there is still room for brands to expand in this market (and even get ahead of their competition).
But which content has a genuine ring to it?
When compared to brand-created material, people are 3.1 times more likely to think user-generated content (UGC) is authentic, and 5.9 times more likely to say it is the most authentic.
In addition to authenticity, 70\% of customers believe it is critical for brands to create a personalized experience, up from 67\% in 2019.
Consumers will reward brands that make a concerted effort to create more relevant and personalized online buying experiences. In fact, 72 percent of customers think they are more likely to buy from a company that can provide them with a more personalized experience on a consistent basis.
UGC (user-generated content) has a significant impact on customer purchase decisions and motivates them to take action
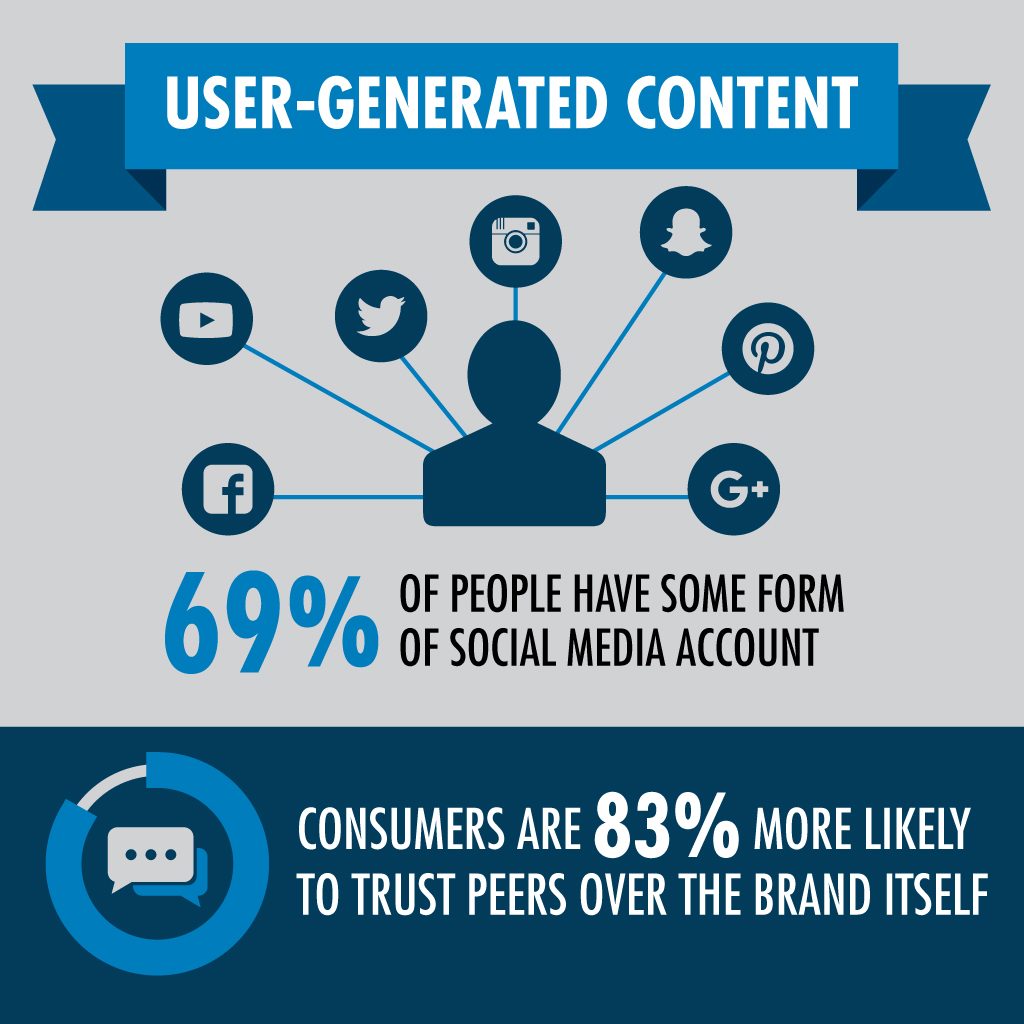
In the perspective of customers, user-generated content is 8.7x more influential than influencer material and 6.6x more influential than branded content, according to our study, with 79 percent indicating it has a significant impact on their purchasing decisions.
Furthermore, 56 percent of shoppers think social media images and videos affect their online purchase decisions now more than they did before the pandemic. This is especially true for Gen Z shoppers, who claim UGC is more influential to them post-COVID-19, with 61\% saying it is.
People also want to use user-generated content as a reference point when buying something online; in fact, 72 percent say it’s the type of information they want to see on eCommerce sites.
Because the website didn’t offer user evaluations or photos, 58 percent of people said they left an eCommerce store without making a purchase. This trend is much more pronounced among Generation Z (64 percent) and Millennials (60 percent).
In the future, brands should concentrate on forming communities

Customers will reward brands that invite them to participate in creator communities, according to our analysis on consumer behavior statistics. After all, user-generated content (UGC) is born from genuine enthusiasm and can serve as a digital version of word-of-mouth.
Some companies have begun to go the additional mile to establish communities of loyal clients. When asked how interested they would be in joining an advocacy network to actively create content for a company they purchased from, 62 percent of consumers—and 65 percent of Gen Z—say they would be likely to join.
Another important benefit of having a creator community is loyalty. People are considerably more likely to stay loyal to a brand if they feel like they’re a part of it. In fact, 61 percent of consumers—including 65 percent of Gen Z—say that if they were encouraged to join a customer advocate community, they would be more loyal and likely to buy from the company.
Conclusion
Looking at the above report, it is clear that Consumer attitudes, behaviors, and purchasing habits are shifting, and many of these new behaviors will persist after the outbreak. People are shopping more consciously, buying local, and embracing internet commerce, even if their purchases are currently based on the most fundamental requirements. Consumers are using the digital to connect, study, and play to combat isolation, and they will continue to do so. It is also clear that we will witness an increase in the virtual workforce in the future as more people choose to work from home and like it.
If these insights excite you, visit our Blog to explore more Industry-related statistics in 2022!