StatusCast Status Page |
79% SW Score The SW Score ranks the products within a particular category on a variety of parameters, to provide a definite ranking system. Read more
Visit Website
|
96% SW Score The SW Score ranks the products within a particular category on a variety of parameters, to provide a definite ranking system. Read more
Visit Website
|
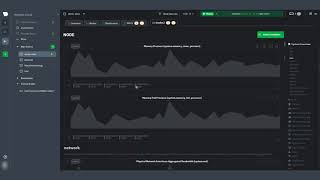
| Description | Netdata is a Linux-based software that helps to diagnose anomalies and slowdowns in your system with insightful analysis, metrics and engaging visualizations. Get a live demo of your system’s performance from various cities in the world. It covers an array of fields where data is provided like RAM, CPU, IP Address, network performance across various bandwidths, softnets, entropy, and disks. It enables you to see monitoring, Nginx, IP Networking and even monitors net data along with programming in MySQL. Netdata can be installed on any platform and detects hundreds of metrics in real-time through fully functional visualizations. It can monitor your health in real-time and moreover it is flexible and easy to integrate with hundreds of metrics. This app allows users to detect low-latency visualizations to detect any possible anomalies after comparison with metrics. The dedicated database of Netdata doesn't require resources to detect. It just collects, stores and processes data to let you visualize in low-latency and high-power resolutions followed by streaming of data and final archive. Read more | Atatus is a SaaS-based application performance and error tracking solution that provides full-stack visibility for all of your applications. Atatus is a full stack observability platform that aids in the discovery and resolution of application performance issues. Our technology can capture millions of performance data points from your applications in real time, allowing you to quickly resolve problems and improve digital consumer experiences. And it all happens in real time, in production, with the option of cloud or on-premise deployment. Atatus ensures that your teams get a comprehensive picture of all the performance indicators required to produce high-quality, dependable software. Find out who, when, and what triggered the performance bottleneck as quickly as possible once an issue arises. Analyze transaction traces, slow database queries, and external requests to other services with Atatus APM to see how your backend is doing and where your app needs optimization. Keep an eye on the health of your apps and receive notifications when there are problems with the user experience. Using Apdex scores, you can evaluate frontend and backend performance as well as user happiness (Application Index). Resolve any issues with performance or availability before they affect your consumers. Read more |
| Pricing Options |
|
|
| SW Score & Breakdown |
79% SW Score The SW Score ranks the products within a particular category on a variety of parameters, to provide a definite ranking system. Read more
|
96% SW Score The SW Score ranks the products within a particular category on a variety of parameters, to provide a definite ranking system. Read more
|
| Total Features |
5 Features
|
14 Features
|
| Common Features for All |
API Monitoring
Alerts (Notifications)
Application Performance Metrics
Dashboard
Event Logs
Event-based Notification
FTP Monitoring
Mail Server Monitoring
Mobile User Monitoring
Page Speed Monitoring
Real-user Monitoring
SSL Monitoring
Synthetic Transaction Monitoring
Uptime Reporting
|
API Monitoring
Alerts (Notifications)
Application Performance Metrics
Dashboard
Event Logs
Event-based Notification
FTP Monitoring
Mail Server Monitoring
Mobile User Monitoring
Page Speed Monitoring
Real-user Monitoring
SSL Monitoring
Synthetic Transaction Monitoring
Uptime Reporting
|
| Organization Types Supported |
|
|
| Platforms Supported |
|
|
| Modes of Support |
|
|
| API Support |
|
|
| User Rating |
Not Available
|
|
| Rating Distribution |
Not Available
|
|
| User Sentiments |
Not Available
|
Ease of Use, Excellent Customer Support, Detailed Performance Breakdown, Intuitive User Interface Limited Data Sampling, High Pricing, Lack of Custom Dashboard, Limited Feature for Mobile Applications |
| Review Summary |
Not Available
|
Atatus is a popular APM tool praised for its user-friendly interface, ease of setup, and exceptional customer support. Users appreciate the detailed insights into application performance, particularly in identifying slow queries and bottlenecks. While some users find the host-based pricing model a drawback, the overall value and in-depth reporting outweigh this concern. Atatus is a strong choice for developers seeking a reliable, effective, and user-friendly APM solution. |
| Read All User Reviews |
AI-Generated from the text of User Reviews
| Pricing Options |
|
|
|
Pricing Plans
Monthly Plans
Annual Plans
|
Agent OSS Free Community Free Pro $3.00 $3.00 per month Business $4.00 $4.00 per month Enterprise Custom |
APM Monitoring Others Real User Monitoring $1.96 $2.60 per month Infrastructure Monitoring Others Logs Monitoring $2.00 $2.50 per month Synthetic Monitoring $1.50 $2.00 per month API Analytics Monitoring $1.00 $1.50 per month Custom Custom |
|
View Detailed Pricing
|
View Detailed Pricing
|
Get personalized recommendations from our experts on call
Trusted by more than 5 Million users across the globe.
Thank you for the enquiry. One of our software analysts will contact you soon.
| Screenshots |

+ 2 More
|

+ 2 More
|
| Videos |
+ 2 More
|
Not Available |
| Company Details | Located in: Redwood City, California Founded in: 2018 | Located in: Chennai, India Founded in: 2014 |
| Contact Details |
Not available |
Not available |
| Social Media Handles |
|
|
Looking for the right SaaS
We can help you choose the best SaaS for your specific requirements. Our in-house experts will assist you with their hand-picked recommendations.
Want more customers?
Our experts will research about your product and list it on SaaSworthy for FREE.


