94% SW Score The SW Score ranks the products within a particular category on a variety of parameters, to provide a definite ranking system. Read more
Keep a track of your campaigns with Whatagraph
This product profile is currently unclaimed.
The listing is published on SaaSworthy, but the official vendor does not yet manage it. Are you part of the Whatagraph team? Claim this profile to manage and update your product information.
Free Trial
Available
The Average Cost of a basic Dashboard Software plan is $29 per month.
Whatagraph pricing starts at $119/month, which is 310% higher than similar services.
35% of Dashboard Software offer a Free Trial , while 45% offer a Freemium Model .
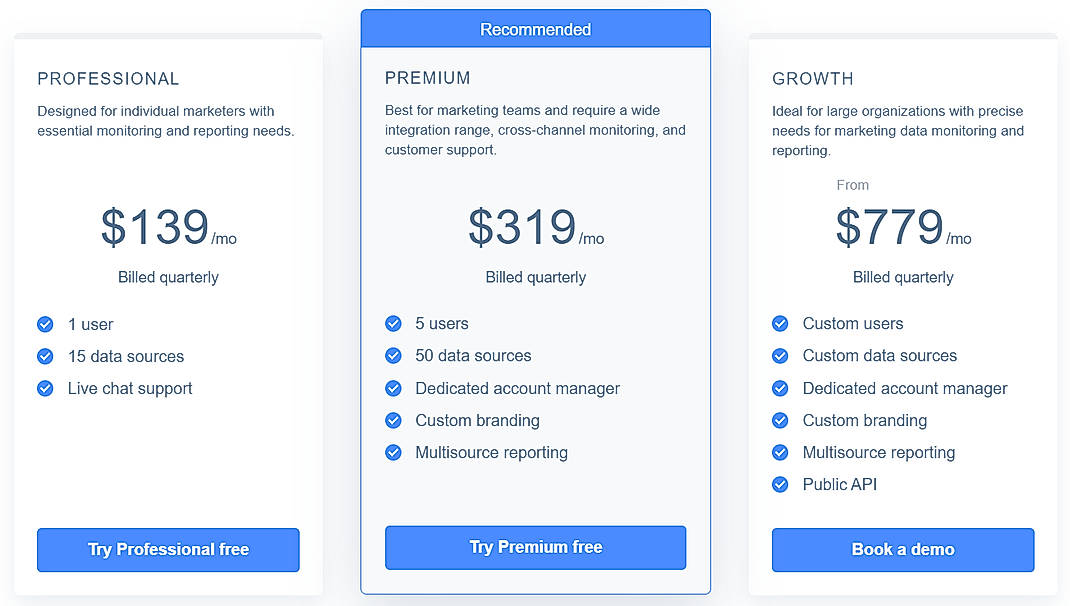
Professional $119.00 $119.00 per month
$119 per month billed annually
$139 per month billed quarterly
Features
Premium $279.00 $279.00 per month
$279 per month billed annually
$319 per month billed quarterly
Features
Growth $699.00 $699.00 per month
$699 per month billed annually
$779 per month billed quarterly
Features
Screenshots of Vendor Pricing Page
How much does Whatagraph cost?
The pricing for Whatagraph starts at $119.00 per month. Whatagraph has 3 different plans:
Learn more about Whatagraph pricing.
Does Whatagraph offer a free plan?
No, Whatagraph does not offer a free plan.
Learn more about Whatagraph pricing.
| Product Name | Starting Price ($) | Billed | Unit | Free Trial | Learn More |
|---|---|---|---|---|---|
|
|
119 | per month | - | Whatagraph Pricing | |
|
|
39 | per month | - | AgencyAnalytics Pricing | |
|
|
33 | per month | - | DashThis Pricing | |
|
|
62.98 | per month | - | Reportz Pricing | |
|
|
49 | per month | - | GreyMetrics Pricing | |
|
|
- | - | - | iDashboards Pricing | |
|
|
49 | per month | - | Analytics Canvas Pricing | |
|
|
- | - | - | myDATA3 Pricing | |
|
|
20 | per month | - | AgencyREPORTER Pricing | |
|
|
9.99 | per month | - | SharpDash Pricing |
96% SW Score The SW Score ranks the products within a particular category on a variety of parameters, to provide a definite ranking system. Read more
96% SW Score The SW Score ranks the products within a particular category on a variety of parameters, to provide a definite ranking system. Read more
95% SW Score The SW Score ranks the products within a particular category on a variety of parameters, to provide a definite ranking system. Read more
95% SW Score The SW Score ranks the products within a particular category on a variety of parameters, to provide a definite ranking system. Read more
90% SW Score The SW Score ranks the products within a particular category on a variety of parameters, to provide a definite ranking system. Read more
83% SW Score The SW Score ranks the products within a particular category on a variety of parameters, to provide a definite ranking system. Read more
81% SW Score The SW Score ranks the products within a particular category on a variety of parameters, to provide a definite ranking system. Read more
81% SW Score The SW Score ranks the products within a particular category on a variety of parameters, to provide a definite ranking system. Read more
91% SW Score The SW Score ranks the products within a particular category on a variety of parameters, to provide a definite ranking system. Read more
96% SW Score The SW Score ranks the products within a particular category on a variety of parameters, to provide a definite ranking system. Read more
80% SW Score The SW Score ranks the products within a particular category on a variety of parameters, to provide a definite ranking system. Read more
94% SW Score The SW Score ranks the products within a particular category on a variety of parameters, to provide a definite ranking system. Read more
77% SW Score The SW Score ranks the products within a particular category on a variety of parameters, to provide a definite ranking system. Read more
78% SW Score The SW Score ranks the products within a particular category on a variety of parameters, to provide a definite ranking system. Read more
70% SW Score The SW Score ranks the products within a particular category on a variety of parameters, to provide a definite ranking system. Read more
Widgets
Displays often used functions and provides quick way for accessing filesVisual Analytics
Provides analytical reasoning with interactive visual interfacePublic Dashboard
It allows sharing dashboards with multiple usersPrivate Dashboard
Dashboards will remain private and will not share information with other users.Predefined Templates
It holds a bundle of built-in templates that can be used in the projectsInteractive Dashboard
It provides easy visualization of dataData Integration
Helps in collecting and combining data from multiple data sources and offer them in a unified manner to the userKey Performance Indicators
Evaluating and measuring the performance of the business which will help you make informed decisions and correcting past mistakesOLAP
It provides online analytics from multiple data and provides an easy view to the user.Data Security
Ensures secure storage of data by encryptionLooking for the right SaaS
We can help you choose the best SaaS for your specific requirements. Our in-house experts will assist you with their hand-picked recommendations.
Want more customers?
Our experts will research about your product and list it on SaaSworthy for FREE.